

Global Warming vs. Climate Change
What’s the difference?
Global Warming: the amount of increased heat due to human activities from the Earth’s climate that is recorded on a geologic time scale from pre-industrial era to present day (1). Can also be shown graphically on a millennial timescale from the Pleistocene Ice Age to present day as well. Human related impacts such as fossil fuel burning increase the amount of greenhouse gases are trapped in the Earth’s atmosphere (1).
The term global warming is often correlated with climate change, but it is most common to use the term global warming to express the average increase in Earth’s global surface temperature (1). Human activities since the Industrial Revolution have increased the Earth’s global average temperature by approximately 1 degree Celsius or 1.8 degrees Fahrenheit (1). It is still currently increasing by 0.2 degrees Celsius or 0.36 degrees Fahrenheit per decade (1).
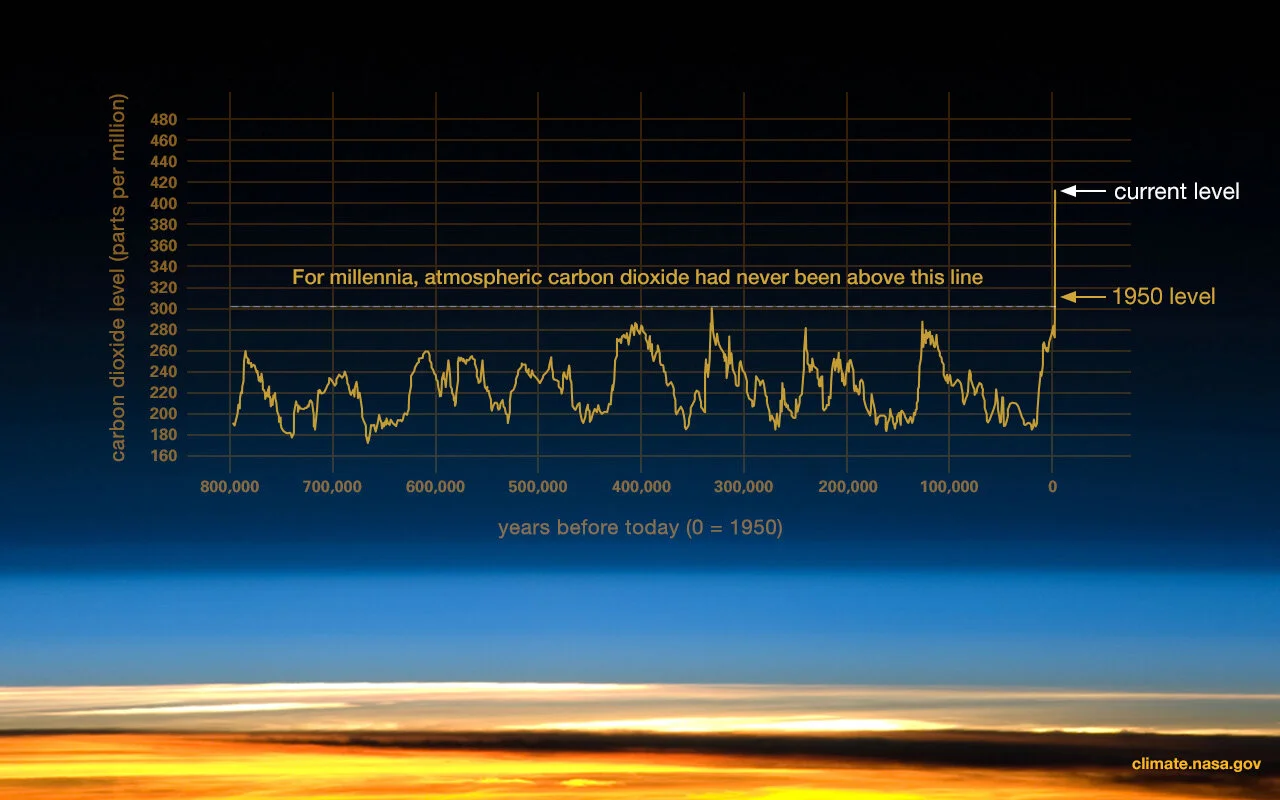
Fig. 1: A graphical comparison of ice core samples that shows evidence for increased atmospheric CO2 since the Industrial Revolution. Credit: Luthi, D., et al.. 2008; Etheridge, D.M., et al. 2010; Vostok ice core data/J.R. Petit et al.; NOAA Mauna Loa CO2 record

Fig. 2: A graph provided by NASA’s Goddard Institute for Space Studies showing changes in global surface temperature primarily relating the average increase from 1951-1980, with the years 2020 and 2016 being the warmest recorded temperatures. Credit: NASA/JPL-Caltech
Climate Change: variations or changes in average weather that have a wide range of impacts that affect local, regional, and global climates (1). The primary drivers of climate change currently is due to human-related activities. Typically, these activities increase heat trapped in the atmosphere via greenhouse gases, commonly known as global warming (1).
Climate change can also be affected by natural processes such as: cyclical ocean patterns (i.e. El Niño, La Niña cycles), volcanic activity, changes in how much energy the Sun emits, as well as shifts in Earth’s orbit (1). Climate change can affect natural systems, with some incidents or events being indicators of the effects of climate change. These can include: ocean acidification, glacial ice loss, extreme shifts in weather patterns (i.e. hurricanes, wildfires, heatwave, and floods), along with many others (1).
How do we know this is happening?
Within the last 650,000 years there have been seven glacial advance and retreat cycles, with the last ice age ending prematurely about 117,000 years ago which scientists have marked as the starting point of our modern climate (2). Most of the previous climate changes were due to small variations in the Earth’s orbit that changed how much solar energy was being emitted onto Earth, but the majority of our current warming trend is due to human activity (2). Scientists have the capability of recording in real time the various types of symptoms of a changing climate and collect this information about our planet and the climate by relying on satellites orbiting Earth to understand the problem on a global scale (2). Looking at the two graphs shown above, we can see the rapid increase in atmospheric CO2 from our last ice age event to the start of the 1950s, as well as how our average global temperature has continuously increased and it is undeniably evident that it’s unlikely to change if there is a continued use of fossil fuels and continued emissions of greenhouse gases trapped in our atmosphere. Ice core sampling can also show scientists how the Earth’s climate responds to a certain amount of greenhouse gases are released (2). By tracing paleoclimate-based levels, these ice core samples reveal that our current warming event is occurring ten times faster than the average rate of the Earth’s ice-age warming period (2). The level of CO2 produced from human activity has increased more than 250 times faster than what was produced from natural sources after our last Ice Age (2,3).
Evidence of climate change is complex and varies but there are physical signs that indicate the effects of climate change are damaging our environment. Such examples include: global temperature rise, warming oceans, shrinking ice sheets, receding glaciers, decreasing snow cover, increased sea level, declining arctic sea ice, extreme weather events, and ocean acidification.
Global temperature rise
Earth’s average surface temperature has increased approximately 2.12 degrees Fahrenheit or 1.18 degrees Celsius since the late 19th century (the start of the Industrial Revolution), this change was solely driven by increased carbon dioxide emissions being trapped in the Earth’s atmosphere (2).
Fig. 3: Video of global temperature change in degrees Celsius since 1880 via NASA GISS data. Credit: NASA's Scientific Visualization Studio. Data provided by Robert B. Schmunk (NASA/GSFC GISS).Why is this important to understand?
Warming oceans
Our oceans are capable of absorbing most of the heat emitted by human activities, with 90% of excess energy being stored in our oceans (2). The average surface levels (approximately 328 feet) of our oceans have shown increased warming of 0.6 degrees Fahrenheit or 0.33 degrees Celsius since 1969 (2, 4).
Fig. 4: Video showing increased sea surface temperature (SST) from the oceans from January 2016 to March 2020. Credit:NASA's Scientific Visualization Studio, data from Multi-scale Ultra-high Resolution (MUR) Sea Surface Temperature (SST) Analysis also referred to as: MUR SST. Analysis - JPL PO DAAC - 2016-2020
Rising sea level
Global sea level has risen about 8 inches (20 cm) within the last century (2). The rate of sea level rise has almost doubled the amount from the last century, and is accelerating by small amounts annually (2). Sea level rise is mostly caused by two main factors relating to global warming: addition of water from melting ice sheets and glaciers, as well as the expansion of seawater as it increases in heat (5).
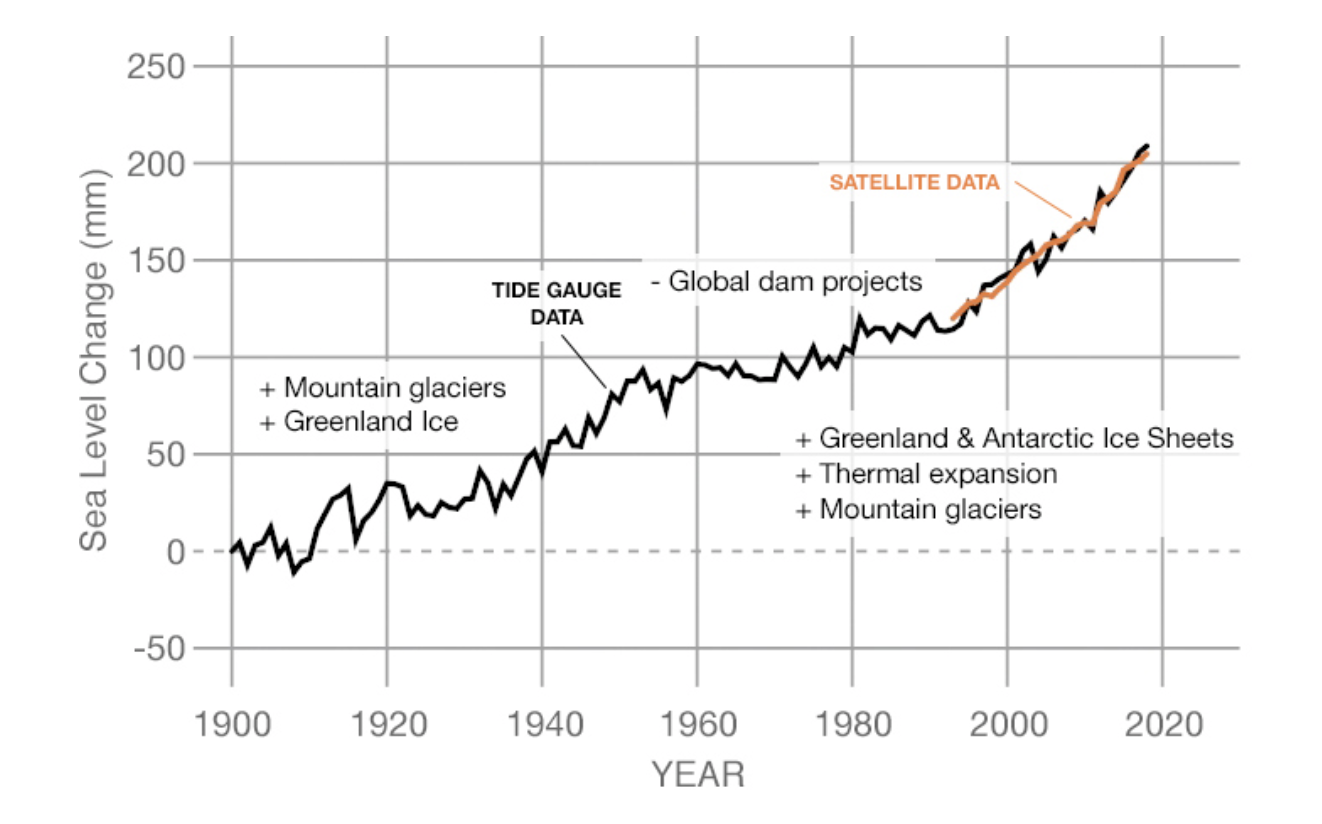
Fig. 5: Graphical representation of increased sea level change (in millimeters) per year from 1900 to 2018, with data recorded from tidal gauge and satellite data. Content with a plus sign (+) are factors that contribute to the increase sea level whereas minuses (-) contribute to sea level decline. All symbols are displayed during the year they were impacting sea level. Data source: Frederikse et al. (2020) Credit: NASA’s Goddard Space Flight Center/PO.DAAC

Fig. 6: Satellite data from 1993 to present, showing sea height variation (in millimeters) per year with a rate of change increased by 3.3 millimeters per year. Data source: Satellite sea level observations. Credit: NASA's Goddard Space Flight Center
Ocean acidification
Since the Industrial Revolution, the levels of acidity has increased by approximately 30% on oceanic surface waters (2). The increase is solely due to the emissions produce by increased CO2 levels in the atmosphere which is then absorbed into the oceans (2). The ocean has absorbed 20% and 30% of total anthropogenic produced carbon dioxide emission in the last few decades, absorbing around 7.2 to 10.8 billion metric tons per year (2). Ocean acidification is a major global threat to our coral reefs. As oceanic temperatures increase, this results in mass coral bleaching and disease outbreaks (6). The increased quantity of CO2 in the ocean reduces the amount of calcification in reef-building or symbiotic organisms affiliated with coral reefs (6). Increase CO2 absorption means there is a decrease in the pH level which results in increased acidification.
Fig. 7: Video showing example of ocean acidification within a lab of a time-lapsed acidification of a sand dollar dissolving in diluted vinegar (pH 4.7). Credit: Cassandra Brooks and John Weller.
Shrinking ice sheets
There are two major ice sheets, the Greenland and the Antarctic ice sheets. Both ice sheets have decreased in large quantities over the past several decades. Data collected from 1993 and 2019 on both ice sheets has shown that the Greenland ice sheet has lost an average of 279 billion tons of ice per year and the Antarctica ice sheet has lost approximately 148 billion tons of ice per year (2).

Fig. 8: Graph showing Antartica ice mass variation since 2002 to our current rate, with an average rate of change decreasing by 150.0 billion metric tons per year. Data source: Ice mass measurement by NASA's GRACE satellites. Gap represents time between missions.
Credit: NASA
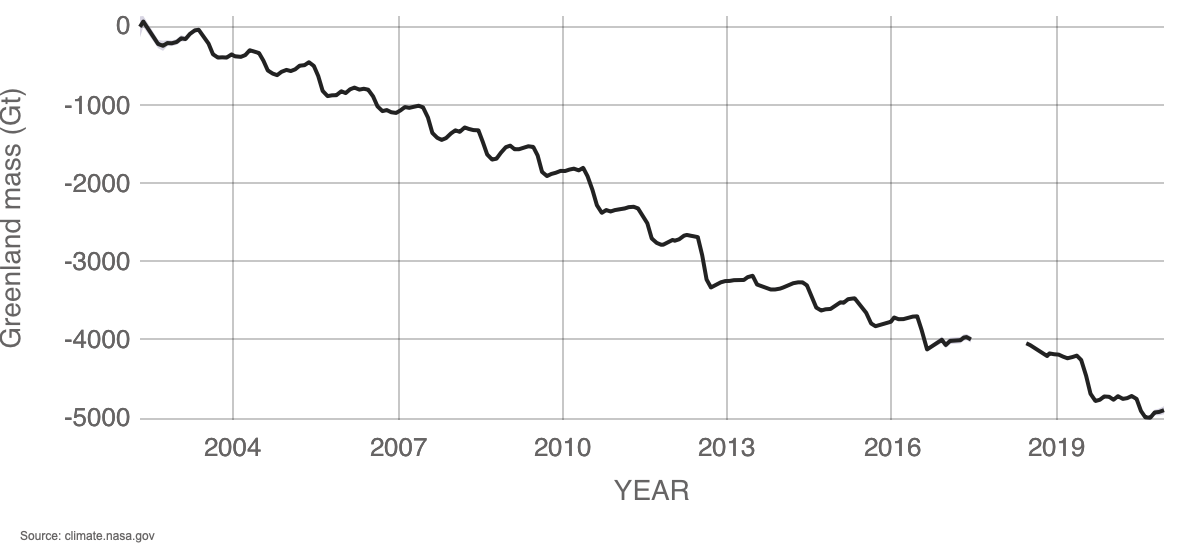
Fig. 9: Graph showing Greenland ice mass variation since 2002 to our current rate, with an average rate of change decreasing by 278.0 billion metric tons per year. Data source: Ice mass measurement by NASA's GRACE satellites. Gap represents time between missions.
Credit: NASA
Decreasing snow cover
Satellite observations have uncovered that the average amount of spring snow cover in the Northern Hemisphere has decreased in the last five decades, with annual snow cover melting earlier than it naturally should (2).
Fig. 10: Satellite view of changes in annual snow cover globally. Credit: NASA's Goddard Space Flight Center/SVS/Trent L. Schindler
References:
“Overview: Weather, Global Warming and Climate Change.” NASA, NASA, 28 Jan. 2021, climate.nasa.gov/resources/global-warming-vs-climate-change/.
“Climate Change Evidence: How Do We Know?” NASA, NASA, 22 Jan. 2021, climate.nasa.gov/evidence/.
Vostok ice core data; NOAA Mauna Loa CO2 record
Gaffney, O.; Steffen, W. (2017). "The Anthropocene equation," The Anthropocene Review (Volume 4, Issue 1, April 2017), 53-61.Levitus, S.; Antonov, J.; Boyer, T.; Baranova, O.; Garcia, H.; Locarnini, R.; Mishonov, A.; Reagan, J.; Seidov, D.; Yarosh, E.; Zweng, M. (2017). NCEI ocean heat content, temperature anomalies, salinity anomalies, thermosteric sea level anomalies, halosteric sea level anomalies, and total steric sea level anomalies from 1955 to present calculated from in situ oceanographic subsurface profile data (NCEI Accession 0164586). Version 4.4. NOAA National Centers for Environmental Information. Dataset. doi: 10.7289/V53F4MVP
“Sea Level: Vital Signs.” NASA, NASA, 8 Mar. 2021, climate.nasa.gov/vital-signs/sea-level/.
US Department of Commerce, National Oceanic and Atmospheric Administration. “How Does Climate Change Affect Coral Reefs?” NOAA's National Ocean Service, 3 Mar. 2015, oceanservice.noaa.gov/facts/coralreef-climate.html.